Design and construct modular gas distribution asset risk models utilizing the spatial and tabular datasets integrated into a new or existing enterprise database.
RiskFrame® DIMP Modeler models and prioritizes risk on a gas distribution pipeline system by bringing in spatial and tabular data from across the enterprise and applying an organization’s risk algorithm or algorithms. Create and run simple or complex risk algorithms which generate risk scores for distribution network assets such as pipe segments, valves, meters, regulators, and other related equipment. Built-in data processing translates spatial feature classes into feature tables that can be combined with other tabular data to evaluate asset risk. Using a risk-based approach to distribution integrity, RiskFrame DIMP Modeler quickly identifies high risk assets, so operators can extract and review data to develop repair and mitigation plans, with shared results for mapping and online analysis.
 Flexible Risk Modeling
Since distribution systems vary widely, the Distribution Integrity Management Program (DIMP) regulations require that each operator must develop a unique risk ranking process based on relevant factors such as the size and geographic location of their system.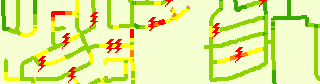 RiskFrame DIMP Modeler provides an easy, complete way of creating and running repeatable risk models. In addition to pre-defined models that can be tailored to a specific system, GeoFields works with operators to develop custom risk algorithms that best fit their gas distribution system and leverages the vast amount of data that is available from disparate sources in the enterprise. From start to end, the process of running a risk model and understanding the results are easy to understand and defend. Every factor and formula is easily defined and any data event in the enterprise database can be included for reporting.
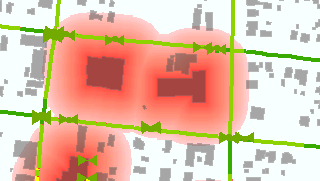 The success of RiskFrame DIMP Modeler comes from the ability of users to defend and understand the risk modeling process, which provides transparency and justification to the risk results.
 Results Mapping
Any column within any risk model results table can be displayed, identified, sorted, symbolized, labeled and exported to a map, allowing engineers to gain valuable knowledge of the spatial risk results without being a GIS professional.
 Data Library
RiskFrame DIMP Modeler incorporates dynamically defined tabular and spatial data sets into a risk model with no preprocessing of data. The data library feature serves to house links to data throughout the organization, including the ArcGIS Gas Distribution Data Model and can be configured as the available data grows. The properties of each risk factor are easily configured and edited to seamlessly integrate new data into the risk model.
 Asset Level Segmentation
RiskFrame DIMP Modeler calculates risk at the individual pipeline system asset level, which allows for the highest level of resolution in your risk scores. A one to one relationship is maintained between risk calculations and the distribution system hierarchy. Modular risk scores are calculated for each asset, so users understand the significance of each contributing factor and how to address these specific threats to reduce the overall risk score.
 Project-Based Analysis
The project concept in RiskFrame DIMP Modeler manages how models proceed, offering model filters that restrict an analysis to certain lines or systems. When models run, a project archive is updated with the results of that particular pass. Archived reports are stored at the enterprise level, which can be easily retrieved and reviewed. Locally saved risk model reports are used to distribute to users who may not have access to the enterprise database or for inclusion in the integrity management plan.
 What-If Scenarios
The net effect of any proposed change(s) in source data state can be modeled for any factor or formula within a risk model without editing the model or committing any actual changes. Running multiple scenarios provides quantifiable changes to threat or risk levels, providing objective justification of the most appropriate remediation activity by showing risk and expense mitigation. By displaying the original and potential model results records side by side, the What-If scenario report provides tools to directly measure the sensitivity of the risk model to integrity management practices.