Manage, query and analyze all enterprise in-line inspection surveys from any vendor. Verify DOT defect classifications, apply growth to determine trends and deliver detailed reports & dig sheets..
RiskFrame® Analyst allows users to access the library of enterprise in-line inspection surveys from any vendor, discover pipeline defects, query anomalies by criteria & organize anomalies into DOT classifications, and create a dig sheet for any recorded anomaly. Analyze and identify critical pipeline defects with the array of powerful ArcGIS modeling scripts. Query results are sorted through the use of a map, tabular and chart views. The defects classification is published to the enterprise database to help track significant defects and can be analyzed by an engineer through the easy to use interface and query tools. In addition, all results are exported and dig sheets are dynamically created to provide field crews with the necessary information to complete maintenance activities in the field.
 Vendor Independent
Survey Data Management
Survey data that comes back from inspection vendors is usually in a flat file or desktop database format that can vary significantly in format from vendor to vendor. RiskFrame Analyst is based on open data standards ensuring survey data from any vendor and any type of survey tool is properly managed. Review and group data provided by specific vendor tool types, date or any other attribute. This makes the process of querying and analyzing data vendor-neutral, allowing consistent analysis of survey data from across the system.
 Multi-Survey Comparison
Pipeline operators are increasingly interested in comparing historical surveys to the most recent survey. Of course, a survey comparison should only be done after a micro alignment (see DataFrame Loader) to ensure the independent datasets are in alignment with one another. Multiple surveys are analyzed and viewed within the same view. This allows corrosion engineers to better understand corrosion growth and the interaction of defects. Corrosion engineers perform calculated corrosion growth analyses by selecting a current defect and its historical counterpart.
 Defect Classifications
RiskFrame Analyst automatically assigns DOT defect classifications to help monitor, track, and report on anomalies of interest. Accordingly, defects are assigned the most immediate repair activity to ensure a proper and timely response. Typical repair conditions include immediate, 60 days, 180 days, scheduled and monitored; however, client specific activities are also assigned to defects which may not meet the regulatory requirements but still require attention. In addditon, all matched criteria are also linked to the defect to include information such as metal loss greater than 80%, bottom side dent near metal loss or cracking, or any other client defined criteria.
 Powerful, DOT and
Client Defect Queries
RiskFrame Analyst allows pipeline operators to set their own criteria for identifying defects, quickly focusing attention on critical defects. Develop custom models in addition to the included standard set of DOT queries. Queries filter data based on any attribute, then proximity searches further focus on defects near HCAs, valves, low or high CP readings, or other features. Typically implementations go through a workshop with GIS/Engineers to review in-line inspection data collection methodologies and explicitly define queries and their classifications.
 Dig Management and Preparation
RiskFrame Analyst dynamically creates dig sheets for selected defects that require physical inspection and maintenance. 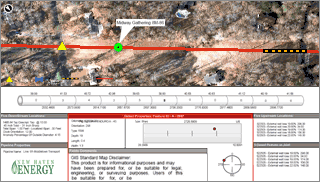 Dig sheets include a map band, elevation band, defects per joint, defect clock position and closest facility references. Dig sheets are customizable based on client requirements and serve as a dig sheet template. As unique scenarios arise, the integrity engineer makes simple dig sheet alterations without altering the template. Once a dig sheet is generated, it is exported as a georeferenced PDF that includes measurement, X/Y positioning and attribute selection tools.
 Server-Oriented Processing Storage
Processing or models are performed on the server so that resources are free on the desktop to continue working when criteria are being ran. All results are stored in the enterprise database. This allows criteria results to be shared across the company.